
Capital expenditures are one of the most closely watched financial metrics in the wireless business. Simply, capex is a measure of how mobile network operators are investing in their wireless infrastructure.
More importantly, capex is how wireless equipment vendors and contracted professional service providers get paid. Supplier organizations rely on MNO capex guidance for planning and managing their businesses, whether they can expect growth or a slowdown.
Capex is nuanced and, in some cases, is not a simple line entry in a financial statement. For instance, AT&T (NYSE: T) and Verizon (NYSE: VZ) several years ago began reporting their total capex without stating the wireless portion.
Both companies claimed they were becoming integrated communications businesses so there was no need to segment the capex. At least, that was the intent. (Disclosure: As a Verizon Wireless and a Verizon Wireline customer, I receive two separate monthly bills and must contact two separate customer service organizations to resolve any issues.)
Reported capex for VZ and T is a composite figure and, on its own, overstates their wireless network investment. Our methodology distills out the wireless portion to portray a realistic view of the volume and trajectory of the U.S. wireless market capex.
Aggregate capex comprises wireless network investment among the Tier 1 MNOs – VZ, T-Mobile (NASDAQ: TMUS), and T, regional wireless carriers such as publicly-held UScellular (NYSE: USM) and Shentel, and a couple dozen privately-held regional service providers such as C-Spire and Carolina West Wireless along with over 600 wireless internet service providers, or WISPs.
Our data excludes private and government networks, except for the public safety network FirstNet component that is baked into T’s capex figure.
Note that these data do not include amounts that MNOs bid in spectrum auctions. Also excluded is the capex that tower companies spend for acquisitions, new tower builds and modifications, ground lease purchases, and maintenance. U.S. towerco capex runs about 10 percent of the carrier total.
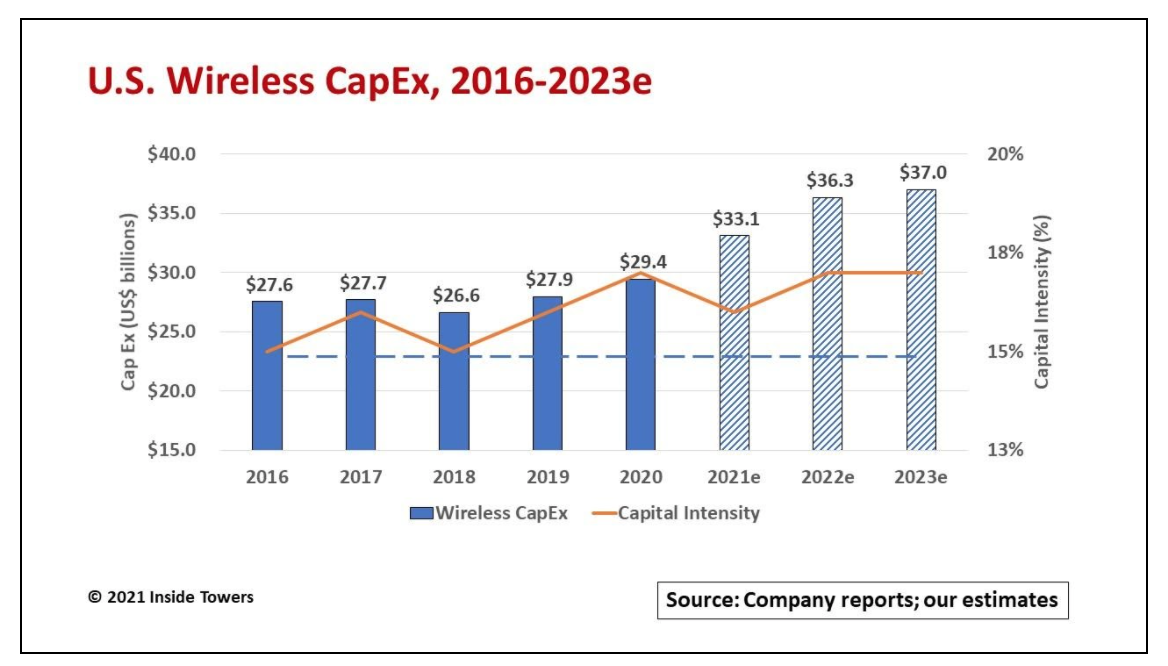
In 2020, U.S. wireless capex reached $29.4 billion, up 5 percent compared to $27.9 billion in 2019. The Tier 1 MNOs account for roughly 95 percent of the total.
TMUS’ capex ramped throughout the year following its merger with Sprint on April 1. The company’s full-year 2020 capex was $11 billion. (see, T-Mobile Fine Tunes Its Network Development Plans)
T’s wireless capex nosedived for the past two years. Its 5G build was measured, COVID impacted its media businesses, and the company struggled with a long-term debt load of over $150 billion. (see, Is AT&T Underinvesting In Its Network?). T spent around $7 billion in wireless in both 2019 and 2020.
VZ invested $10.5 billion in wireless in 2020, up 11 percent on a year-over-year basis to roll out its Nationwide 5G on low-band spectrum and Ultra Wideband 5G using millimeter wave spectrum. The missing link for VZ was adequate mid-band capacity which it solved with lead bids in the recent 3.5 GHz CBRS and 3.7 GHz C-band auctions.
Overall, U.S. wireless capex will be driven for the next several years by competitive market forces, escalating customer mobile data demand, and government funding programs to help expand broadband reach across the country.
Aggregate network investment in 2021 is expected to reach $33 billion, a jump of over 12 percent YoY.
The increase comes from several sources. TMUS will accelerate its 5G deployments and integration of the acquired Sprint cell sites.
DISH is getting into the game with its first 5G site installations in late 2021, then will ramp up for several years. The company plans to spend $10 billion over seven years to build its 5G network.
VZ and T will begin installing C-band sites by the end of 2021, when the first spectrum clearing deadline is met for the top 46 markets. (see, Rockin’ the C-band!). VZ has committed an incremental $10 billion over three years to build out its trove of C-band licenses. AT&T said it too will spend an additional $6-8 billion over 3-4 years for C-band applications. All C-band license holders, particularly T-Mobile and UScellular, will increase deployments in late 2023 and beyond once the second clearing deadline is met.
The other key metric at play here is capital intensity. That metric is calculated as a function of capex divided by service revenues.
A capital intensity of 15 percent or higher indicates that MNOs are in network expansion and upgrade mode. A figure below 15 percent suggests that MNOs have slowed their network investments and are either in a steady-state operating mode or have scaled back to a maintenance mode. Capital intensity varies among MNOs.
In the aggregate, expect a positive outlook for U.S. wireless capex over the next several years.
By John Celentano, Inside Towers Business Editor
Reader Interactions