
The National Telecommunications and Information Administration (NTIA) released a new publicly available digital map that displays key indicators of broadband needs across the country. NTIA says this is the first interactive, public map that enables users to explore different datasets about where people do not have quality internet access.
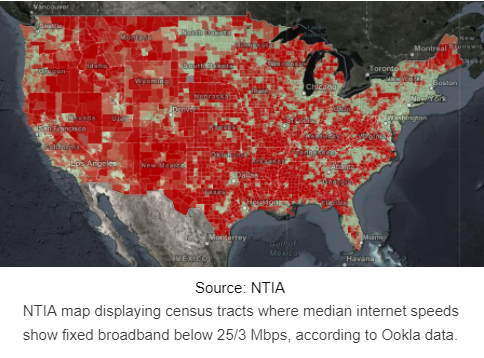
The public “Indicators of Broadband Need” tool also puts data from both public and private sources on one map, which NTIA claims is also a first. It contains data aggregated at the county, census tract, and census block level from the U.S. Census Bureau, the FCC, M-Lab, Ookla and Microsoft. Speed-test data provided by M-Lab and Ookla help to illustrate the reality that communities experience when going online, with many parts of the country reporting speeds that fall below the FCC’s current benchmark for fixed broadband service of 25 Mbps download, 3 Mbps upload. This is also the first map that allows users to graphically compare and contrast these different data sources, according to NTIA.
The map puts poverty and lack of broadband access on the same page. The dataset allows readers to see where high-poverty communities are located and how that relates to internet usage patterns, as well as to a lack of computers and related equipment.
The map also shows use patterns in tribal communities, which have historically suffered from lack of internet access. Users can toggle the separate data sets on and off to compare information, and search for specific locations, including tribal lands and minority-serving institutions, to gain a better understanding of where broadband needs are greatest.
“Any effort to close the digital divide starts with solid data, and NTIA continues to help policymakers make more informed decisions on expanding broadband access,” said Acting NTIA Administrator Evelyn Remaley. “Now, the public can benefit from our platform to see which areas of the country still don’t have broadband at speeds needed to participate in the modern economy.”
“Broadband is no longer nice to have. It’s need to have,” said FCC Acting Chairwoman Jessica Rosenworcel. “To ensure that every household has the internet access necessary for success in the digital age, we need better ways to accurately measure where high-speed service has reached Americans and where it has not.” She called the NTIA map “a welcome new tool that provides valuable insight into the state of broadband across the country.”
NTIA also offers to state governments and federal partners a geographic information system (GIS) platform called the National Broadband Availability Map (NBAM) that provides more complex tools for analyzing broadband access, such as the ability to upload GIS files to compare proposed projects. Earlier this month, NTIA announced that Arizona, Idaho, Kansas, Maryland, Mississippi, and South Dakota have joined the growing roster of state participants in the NBAM, bringing the total number of participating states to 36. The mapping platform allows these states and others to better inform broadband projects and funding decisions.
Reader Interactions